Do you know what they are?

Web page logs are records that contain information about the activities carried out on the web server hosting the page. Every time a web page is requested, the server records information about the request in a log file. These log files are known as "logs".
Logs can include information such as the IP address of the user who requested the page, the user-agent employed (very useful for detecting bots from both tools and browsers), the date and time of the request, the type of browser used, the page requested, and the HTTP response code.
Logs provide valuable information about site traffic, and even about potential attacks or what is consuming the bandwidth of a web project. They also help us detect errors and other technical issues that may affect the performance and security of the site, and even to carry out an analysis of the user experience on the website.
It is possible that in the analyses we carry out with our SEO tools, we may not detect traffic spikes where the website becomes saturated, and there may actually be moments when the site returns 5xx errors, resulting in lost business opportunities. This is why logs are an additional source of useful information for audits.
With logs we can detect:
We must bear in mind that, although logs are very useful and it is even advisable to keep copies of them in other storage locations, these files can take up quite a lot of server space. Over time, just as with backups, if they are not moved elsewhere and there is no automatic deletion in place, they can monopolise all the hard drive space on the server and cause significant WPO issues on the website.

There are various tools that allow you to analyse logs with friendly and pleasant interfaces. Screaming Frog has a fairly comprehensive tool. It is important to stress that this tool is a separate tool from Screaming Frog Spider, and its licence must be purchased separately.

So first let us look at what a log is, how to analyse it manually to understand it, and then we shall verify it with various free tools, and of course, in a more complete manner with paid tools.
Here is an example of a snippet of a LOG; they are generally titanic files. Viewing them manually can be quite daunting, and even more so without colour coding.
But it is much simpler to know when they can be useful if we understand the information they contain.
Firstly, we need to be clear that what we are doing is recording information from each request or query made on our website. The log data is the server information we have available for each and every one of those queries.
138.201.20.219 - - [21/Mar/2023:01:29:18 +0100] "HEAD / HTTP/1.0" 200 137 "-" "Mozilla/5.0 (compatible; SISTRIX Optimizer; Uptime; +https://www.sistrix.com/faq/uptime)"

88.203.186.24 - - [21/Mar/2023:01:34:19 +0100] "GET /seo-avanzado/ HTTP/1.0" 200 10093 "-" "Mozilla/5.0 (X11; Linux x86_64) AppleWebKit/537.36 (KHTML, like Gecko) HeadlessChrome/88.0.4298.0 Safari/537.36"

31.13.127.23 - - [21/Mar/2023:11:23:20 +0100] "GET /wp-content/uploads/og-nginx.jpg HTTP/1.0" 200 26824 "-" "facebookexternalhit/1.1 (+http://www.facebook.com/externalhit_uatext.php)"

66.249.64.119 - - [21/Mar/2023:13:16:31 +0100] "GET /servicios/departamento-seo/ HTTP/1.0" 200 8064 "-" "Mozilla/5.0 (compatible; Googlebot/2.1; +http://www.google.com/bot.html)"

52.114.75.216 - - [21/Mar/2023:09:48:23 +0100] "GET /wp-content/themes/sanchezdonate/images/favicon/favicon.png HTTP/1.0" 200 24353 "-" "Mozilla/5.0 (Windows NT 6.1; WOW64) SkypeUriPreview Preview/0.5 skype-url-preview@microsoft.com"

5.175.42.126 - - [21/Mar/2023:13:22:18 +0100] "POST /wp-cron.php?doing_wp_cron=1679401338.0174319744110107421875 HTTP/1.0" 200 706 "https://carlos.sanchezdonate.com/wp-cron.php?doing_wp_cron=1679401338.0174319744110107421875" "WordPress/6.1.1; https://carlos.sanchezdonate.com"

88.203.186.24 - - [21/Mar/2023:01:34:20 +0100] "GET /wp-includes/js/jquery/jquery.min.js?ver=3.6.1 HTTP/1.0" 200 31988 "https://carlos.sanchezdonate.com/seo-avanzado/" "Mozilla/5.0 (X11; Linux x86_64) AppleWebKit/537.36 (KHTML, like Gecko) HeadlessChrome/88.0.4298.0 Safari/537.36"

54.39.177.173 - - [21/Mar/2023:09:36:13 +0100] "GET /x-robots-tag/ HTTP/1.0" 301 897 "-" "Mozilla/5.0 (compatible; YaK/1.0; http://linkfluence.com/; bot@linkfluence.com)"

192.168.1.1 - jaimito.soler [21/Mar/2023:15:23:45 -0700] "GET /pagina-secreta HTTP/1.1" 200 5120 "https://carlos.sanchezdonate.com/seo-avanzado" "Mozilla/5.0 (Windows NT 10.0; Win64; x64) AppleWebKit/537.36 (KHTML, like Gecko) Chrome/96.0.4664.110 Safari/537.36
It is perfectly normal for this code to look intimidating, which is why it has been colour-coded. So I shall explain each part, bringing together different examples to make it clearer:
Better than using a standard text editor, you can view them with CloudVyzor's LogPad, which makes manual inspection far more readable.
With this tool, we can organise all this data to analyse it and draw relevant conclusions.
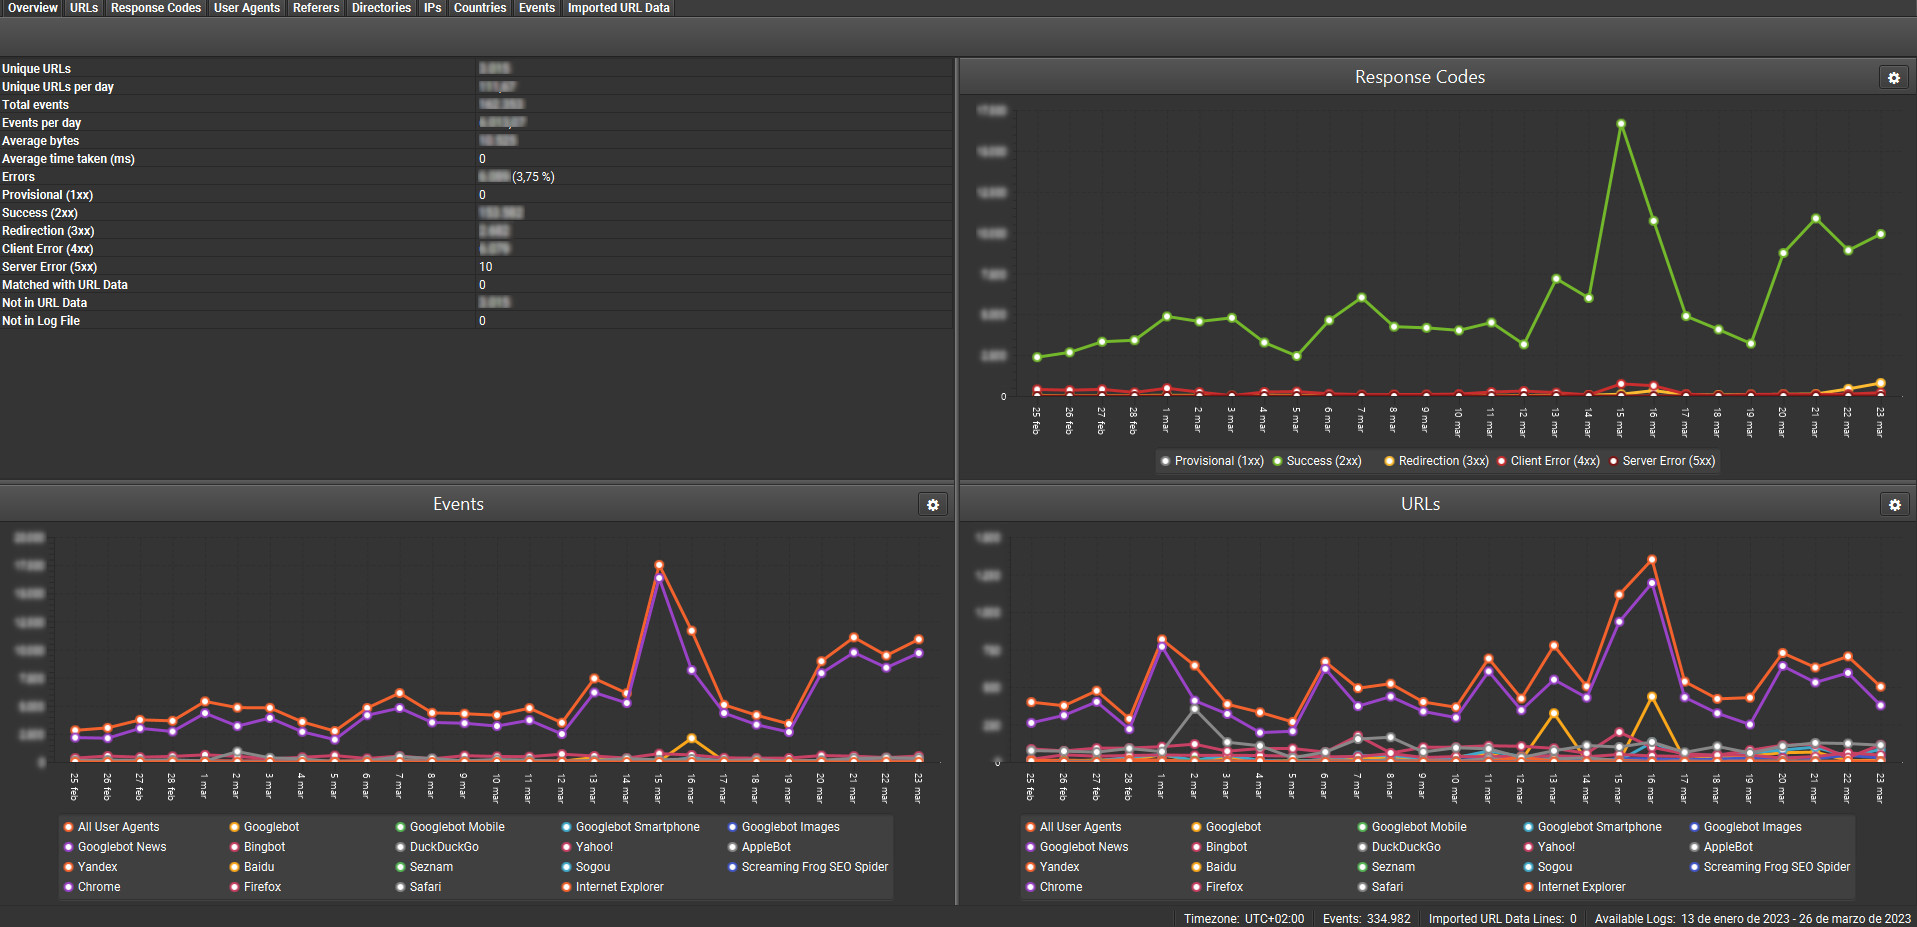
Once we have the important data, let us look at the basics and each of the most interesting tabs:
This allows us to have a graph of the traffic on our website, the error percentage, and the dates on which those errors were detected. We can segment by different user-agents and dates.
It is important to know that by default the tool does not collect all of them. Therefore, it is possible that we may not initially detect unusual traffic from malicious user-agents.


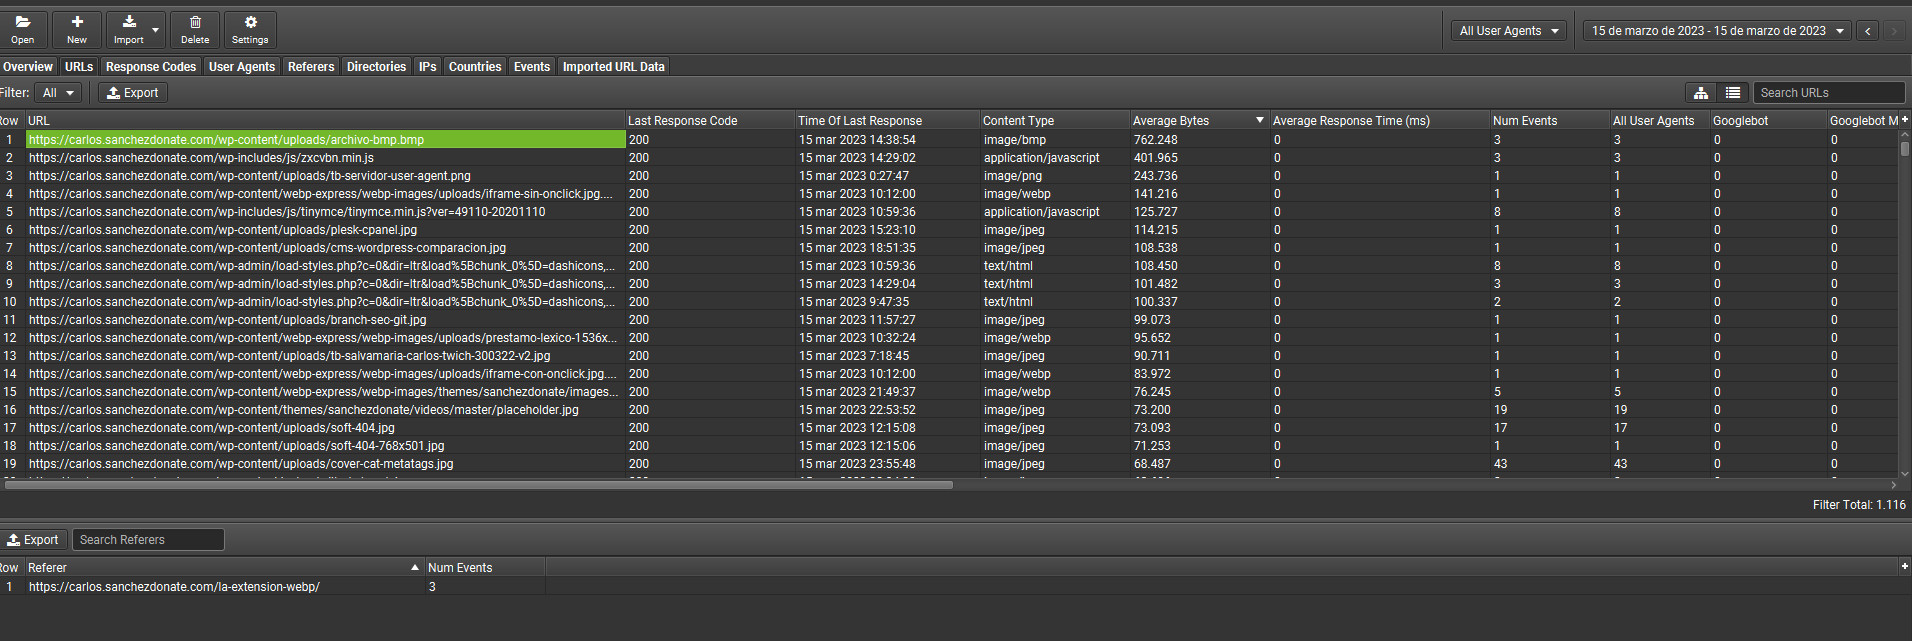
This allows us to easily detect which files on our website are consuming the most bandwidth. From which pages and even why.
This allows us to analyse from which location, according to our server, the request originates. You will be able to verify with this tool that genuine Googlebot requests come from the USA. We can then detect fake crawls and eliminate them.

For this to work, you will need to go to Project and then to Verify Bots. It will take approximately one minute, and you will be able to check it quickly.
Those would indeed be the most basic aspects when it comes to analysing logs. We can check whether Googlebot is reaching areas it should not, bypassing a "nofollow", or whether it is actually accessing from another location. It is also useful for verifying whether we are being persistently crawled by various tools or users.
Evidently, what has been presented here is only a fraction of the potential that the Screaming Frog tool offers. There are free alternatives, but I am not covering them because in truth I do not regularly work with them.
I currently offer advanced SEO training in Spanish. Would you like me to create an English version? Let me know!
Tell me you're interestedIf you liked this post, you can always show your appreciation by liking this LinkedIn post about this same article.